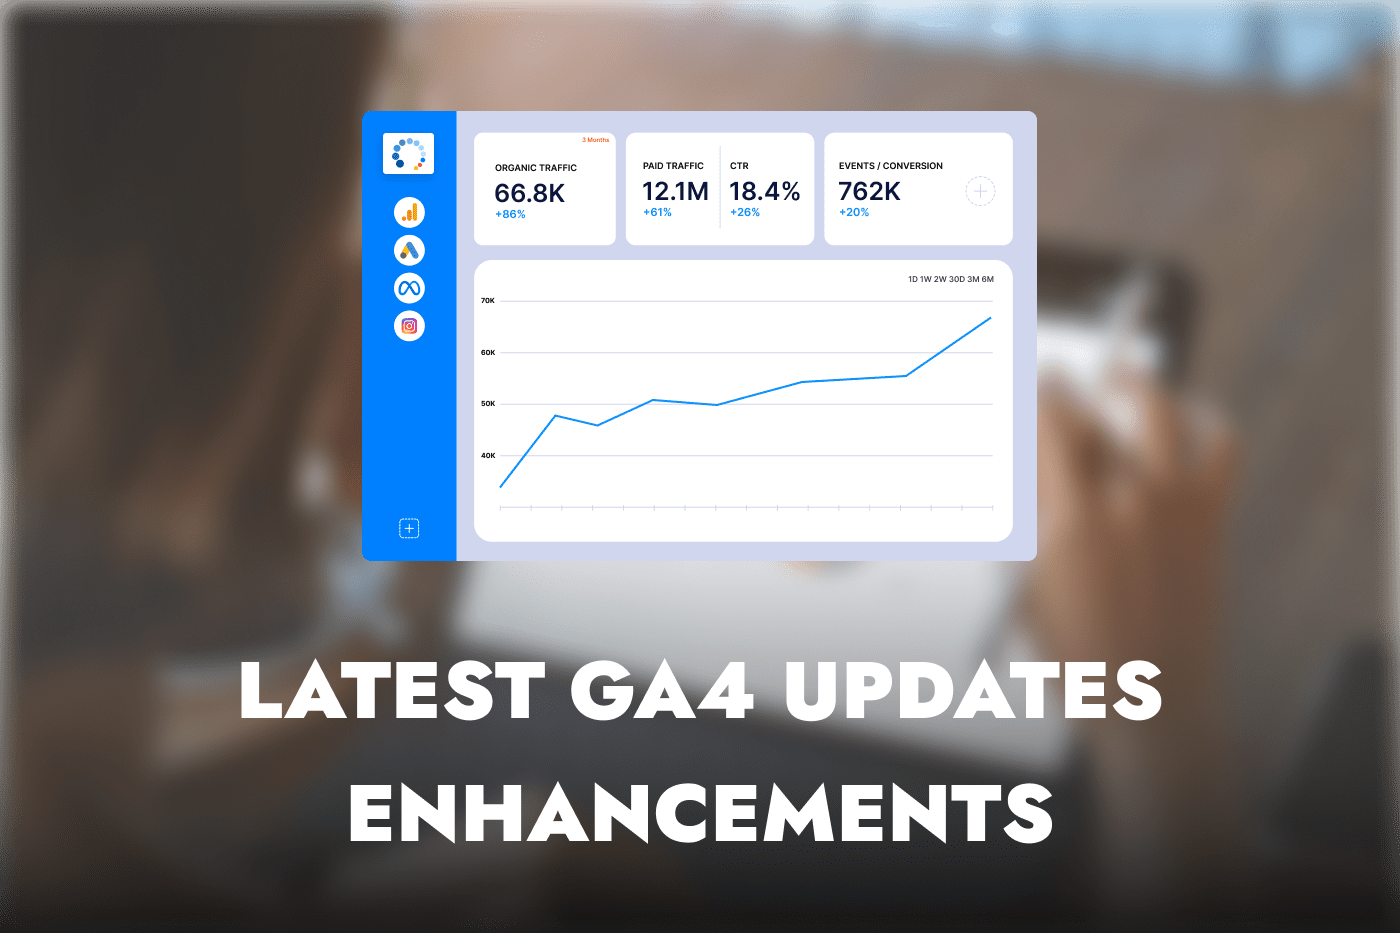
In September 2024, Google introduced a series of powerful Latest Google Analytics 4 features updates to Google Analytics 4 (GA4) aimed at enhancing the reporting capabilities and providing deeper insights for marketers and analysts. These changes allow users to visualize data more effectively, uncover hidden trends, and make data-driven decisions more easily. Here, we will dive into the latest features and their significance for businesses leveraging GA4 for performance analysis and growth.
GA4 September 2024 Update: New Features and Enhancements
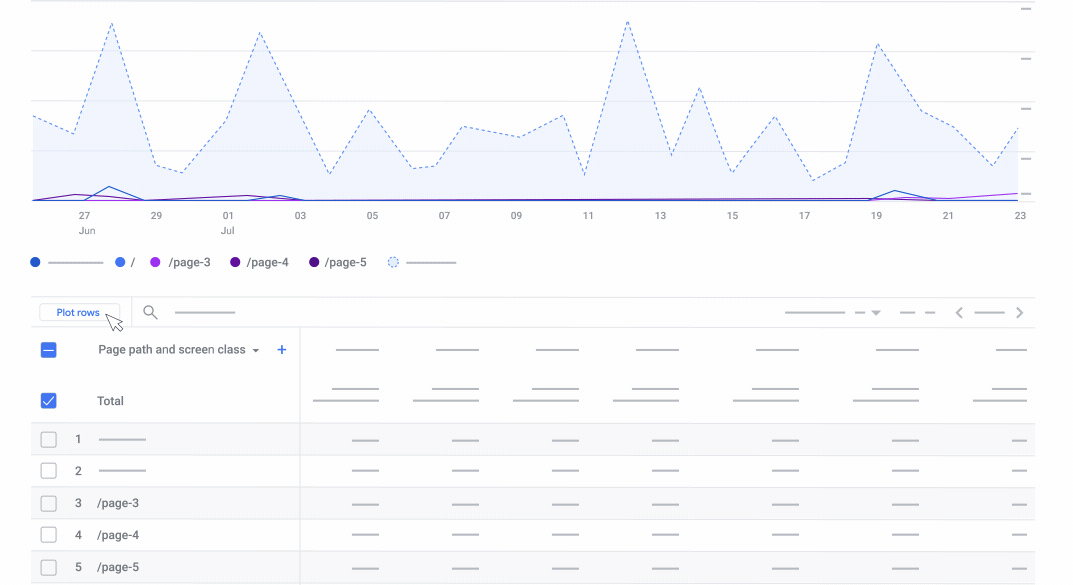
Report Visualization with Plot Rows
One of the standout features in this update is the ability to visualize up to five rows of data in reports using the new Plot Rows functionality. This Google Analytics 4 features simplifies the process of comparing different data points directly within your reports. Whether you’re tracking multiple traffic sources, monitoring user behavior metrics, or comparing campaign performances, Plot Rows enables a clearer visual comparison through line charts.
By selecting rows in your detail report and clicking on the “Plot Rows” option, users can generate individual lines for each data row, streamlining analysis and aiding in rapid decision-making.
Anomaly Detection GA4 in Detail Reports
Another groundbreaking feature is the introduction of anomaly detection GA4 in detail reports. Google now flags unusual data patterns automatically, alerting users to potential issues like sudden traffic spikes or drops. These Google Analytics 4 features are crucial for businesses as it highlights hidden trends that may go unnoticed, offering insights into unexpected performance shifts.
For instance, if you see a sudden rise in bounce rates or a dramatic drop in sessions, anomaly detection GA4 will flag it, helping you to quickly investigate and resolve issues before they impact your business goals.
Google Analytics 4 features: Enhanced Reporting Capabilities
- Report Descriptions: Every report title now includes hover-over descriptions, providing clarity on the purpose of the report. These short descriptions also contain links to further information, making it easier for users to explore the functionality and learn how to utilize each report effectively.
- Marking Key Events: In the Events Report, users can now mark significant events as “key events” using the three dots menu. This helps prioritize the most important metrics, such as conversions or high-value interactions, ensuring these data points are highlighted for quicker review.
Transaction and Acquisition Reports
- New Transactions Report: Google introduced a dedicated Transactions Report to provide granular insights into revenue streams. This report captures transactional details by tracking the transaction_id parameter, allowing businesses to break down the performance of individual purchases and revenue generation activities.
- Updated Acquisition Reports: A significant change has been made in acquisition reporting, with GA4 now offering more focused insights based on user and session data. The User Acquisition Report now presents user-centric metrics like Total Users, New Users, and Returning Users, while the Traffic Acquisition Report focuses on session-based metrics such as Sessions, Engaged Sessions, and Sessions per Event. This differentiation provides clearer insights for understanding both new and returning users’ behaviors, as well as how effectively your website and marketing campaigns are driving engagement.
Plot rows in GA4: Implications for Marketers
These updates mark a significant step forward in improving the user experience in GA4. With more intuitive reporting features, businesses can quickly identify key trends and anomalies, leading to faster and more informed decisions. Plot Rows and anomaly detection, in particular, offer a much-needed enhancement to data analysis capabilities, enabling users to visualize and act on trends more efficiently.
Acquisition Reports GA4
Moreover, the updated transaction and acquisition reports provide a clearer view of performance by separating user and session metrics, allowing businesses to tailor their marketing strategies based on actionable insights.
Conclusion
Google’s September 2024 update to GA4 introduces several new features that enhance both usability and analytical depth. Whether you’re a business tracking eCommerce performance, analyzing user acquisition, or monitoring event data, these improvements offer the tools needed to drive more effective decision-making.
Anomaly Detection GA4: From the simplified visualization with Plot Rows to the anomaly detection GA4 feature flagging irregularities, GA4 has become even more powerful for businesses aiming to optimize their digital strategies. If you’re not already using these features, now is the time to integrate them into your analytics workflow.